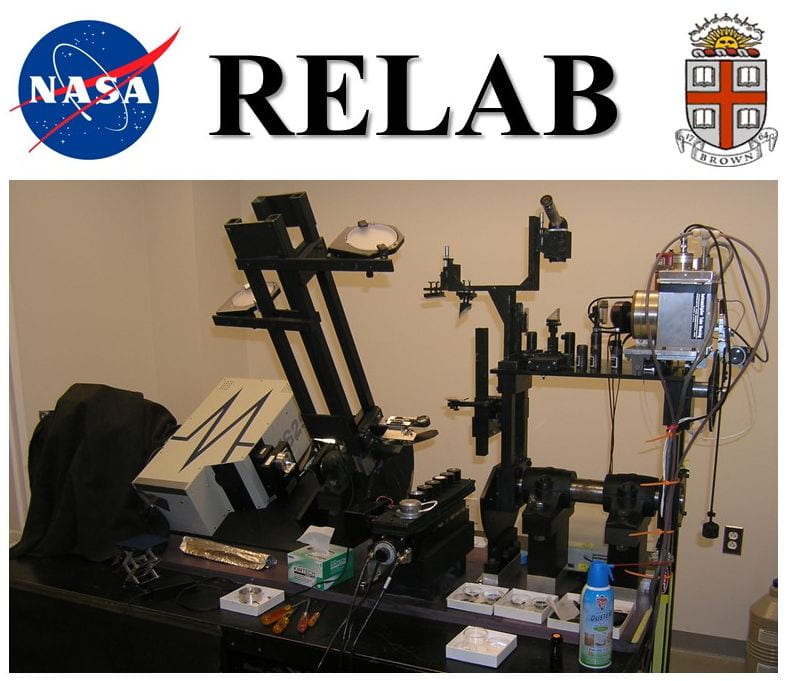
Welcome to the online database of the Lunar Rock and Mineral Characterization Consortium (LRMCC). The LRMCC conducted coordinated mineralogy, petrography, and reflectance spectroscopy analyses of a suite of lunar mare basalt samples. The studied sample suite includes two low titanium samples collected from the Apollo 15 site (15058 and 15555) and two high titanium samples collected from the Apollo 17 site (70017 and 70035). The LRMCC was allocated paired thin section and slab subsamples of each sample. Thin sections were used for petrographic analyses (including modal abundances and chemical compositions of mineral phases), and the slab samples were used to prepare particulate mineral separates and bulk samples. The compositions of the mineral separates were analyzed by electron microprobe analysis of grain mounts. Petrographic analyses and mineral separate preparation were performed at the Planetary Geosciences Institute in the Department of Earth and Planetary Sciences at the University of Tennessee in Knoxville, TN. The particulate samples were crushed and sieved to a series of standard grain sizes (“coarse grained” and “< 45 µm”) and analyzed with reflectance spectroscopy in the RELAB, in the Planetary Group of the Department of Geological Sciences at Brown University.
Full documentation of the samples, analytical procedures, and results can be found in:
Isaacson, P. J., A. Basu Sarbadhikari, C. M. Pieters, R. L. Klima, T. Hiroi, Y. Liu, and L. A. Taylor (2011), The Lunar Rock and Mineral Characterization Consortium: Deconstruction and Integrated Mineralogical, Petrologic, and Spectroscopic Analyses of Mare Basalts, Meteorit. Planet. Sci., 46, 228-251, doi:10.1111/j.1945-5100.2010.01148.x.
In case of any discrepancy between the descriptions and data provided in this database and those provided in the published manuscript, the published manuscript should be considered the document of record. If you note any problems with this database, please contact Peter Isaacson (contact information can be found in the MaPS reference). Please reference this manuscript when using data obtained from this database.
This database is intended to make the results of the LRMCC study available to the lunar and planetary research communities. The reflectance spectroscopy results, chemical compositions of major mineral phases (in thin section and in mineral separates), and modal abundance results from thin section analyses are provided. Note that one must use caution in using the modal abundance data in association with mineral separate and bulk sample reflectance spectra, as the mineral separates were prepared by hand based on optical differences, and do not correspond directly to the chemical composition-based distinctions of mineral phases used for modal analyses of the thin sections. Please see the discussion in the given reference for details.
Funding for this work was provided by NASA LSI contract number NNA09DB34A as well as Cosmochemistry Program contract numbers NNG05GG15G and NNG05GG03G.
Spectral Reflectance Data
Spectral reflectance data are provided for mineral separates and the particulate bulk samples. Spectral reflectance data are provided in comma separated value (.csv) format. Each spectrum is provided as a single file. Each file contains one header line. There are 4 columns for each file: Wavelength (nm), Wavelength (mm), Wavelength (cm-1), and Reflectance. Some files may contain a fifth column, which records the variation observed during acquisition of the reflectance value at that wavelength. Files are named with the following convention: RELABID_SampleNumber_SampleName_ParticleSize_WavelengthRange.csv. “RELABID” refers to the ID code of the sample in the RELAB database. Sample number will indicate one of the four samples (15058, 15555, 70017, 70035). Sample name indicates the specific sample, as discussed in the Isaacson et al. reference. ParticleSize indicates coarse or fine. WavelengthRange indicates the wavelength coverage of the file, as described below:
Wavelength ranges:
BDR: Measured with the bidirectional reflectance spectrometer with a geometry of i = 30°, e = 0°. Wavelength coverage of 280 nm – 2600 nm, 5 nm spectral sampling.
VIS: Measured with the same instrument and geometry as BDR. Wavelength coverage of 400 – 600 nm, 0.5 nm spectral sampling.
UV: Measured with the same instrument and geometry as BDR. Wavelength coverage of 280 – 400 nm, 1 nm spectral sampling.
Full: Measured with a combination of the bidirectional reflectance spectrometer at I = 0°, e = 30° and the FT-IR spectrometer. FT-IR measurements are spliced with the BDR measurement, typically at a wavelength of ~2550 nm, to produce the composite “full wavelength” coverage extending to ~25 µm. Spectral sampling is variable and not necessarily consistent between files.
The full dataset (all samples, all particle sizes, all wavelength ranges) can be downloaded (in .zip format) here.
