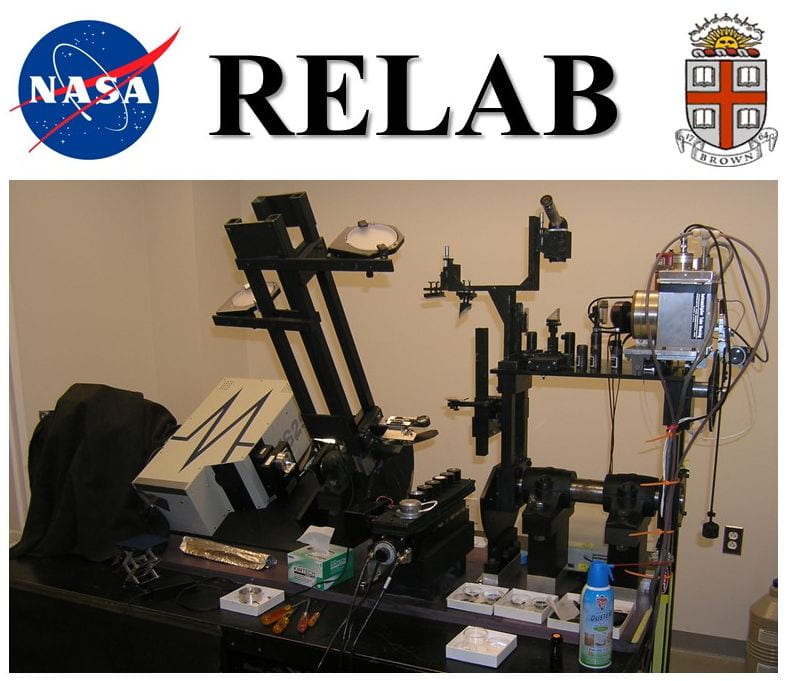
Description of the data (0.3 – 2.6 μm)
All spectra were obtained at i=30 degrees, e=0 degrees. There are an image file and a data file for each soil measured by the LSCC. Click on the image file for a larger version. Each data file contains reflectance factor spectra for all soil size fractions and a standard deviation measurement for each data point, where appropriate. Each data file contains a header line followed by nine entries of tab-delimited reflectance data (as text): Wavelength, soil <10 micrometers, standard deviation, soil 10-20 micrometers, standard deviation, soil 20-45 micrometers, standard deviation, bulk soil <45 micrometers, standard deviation (some standard deviation fields are empty).
For measurement and analysis details, see discussion in:
Pieters, C. M., L. A. Taylor, D. S. McKay, S. Wentworth, R. V. Morris, and L. P. Keller, Spectral characterization of lunar mare soils. Lunar Planet. Sci. XXXI, Abstract #1865, 2000.
Taylor, L. A., C. M. Pieters, R. V. Morris, L. P. Keller, and D. S. McKay 2001, Lunar mare soils: Space weathering and the major effects of surface-correlated nanophase Fe., Journal Geophysical Research, 106 (E11), 27,985-28,000, 2001.
The Lunar Soil Characterization Consortium (LSCC) has also performed detailed chemistry and modal abundance analyses on each of these samples.
This compositional data can be found here
Mare Data Files:
Apollo 14 Data Files:
Apollo 16 Data Files:
